The Human Genetic Interaction Map

Welcome to the genetic interaction (GI) network data portal where you can access over 88,000 GIs mapped in the HAP1 human haploid cell line. Search your gene of interest to find essentiality profiles, GI scores, GI profiles, and gene co-dependencies.

About

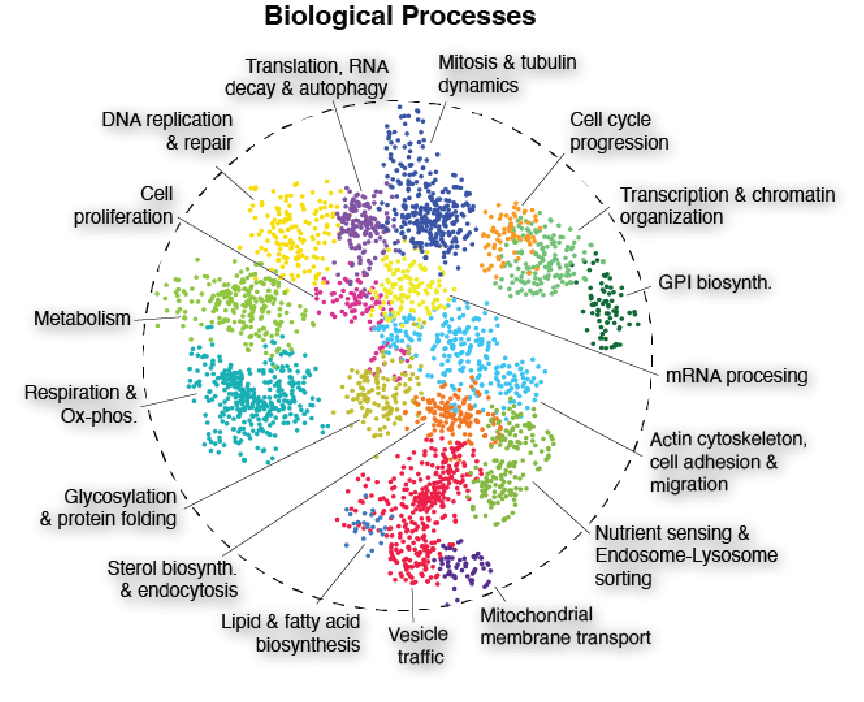
Generated from comprehensive mapping of the human genetic interaction network (GIN) in an isogenic HAP1 cell line background using the state-of-the-art TKOv3 CRISPR library. The current network is derived from >5 million double-mutant fitness measurements including more than 47,000 negative GIs and 41,000 positive GIs.

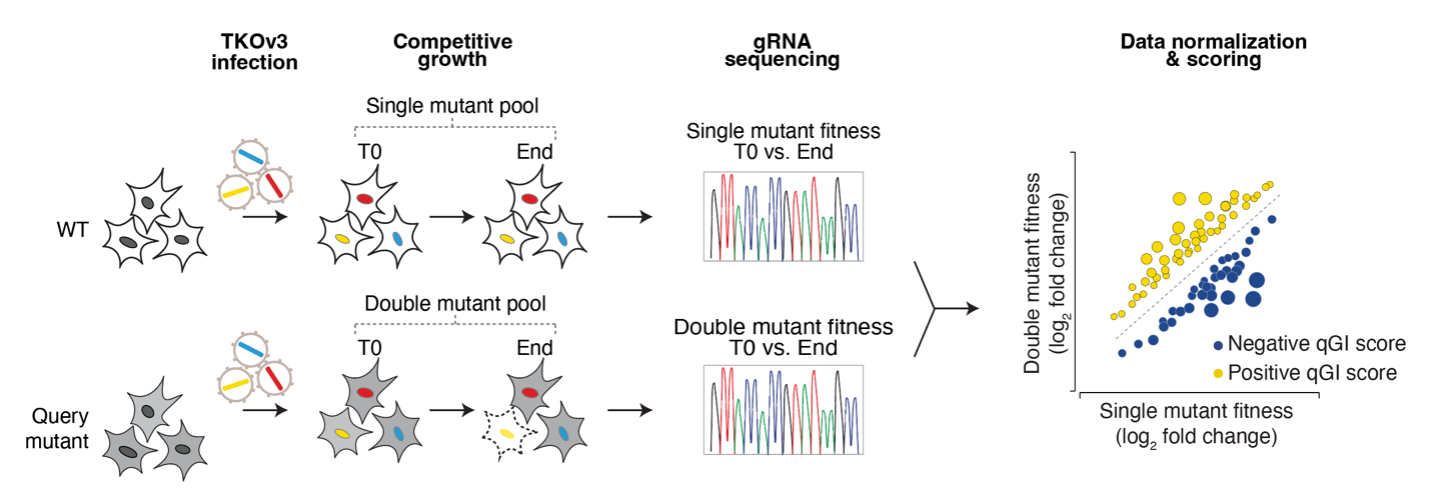
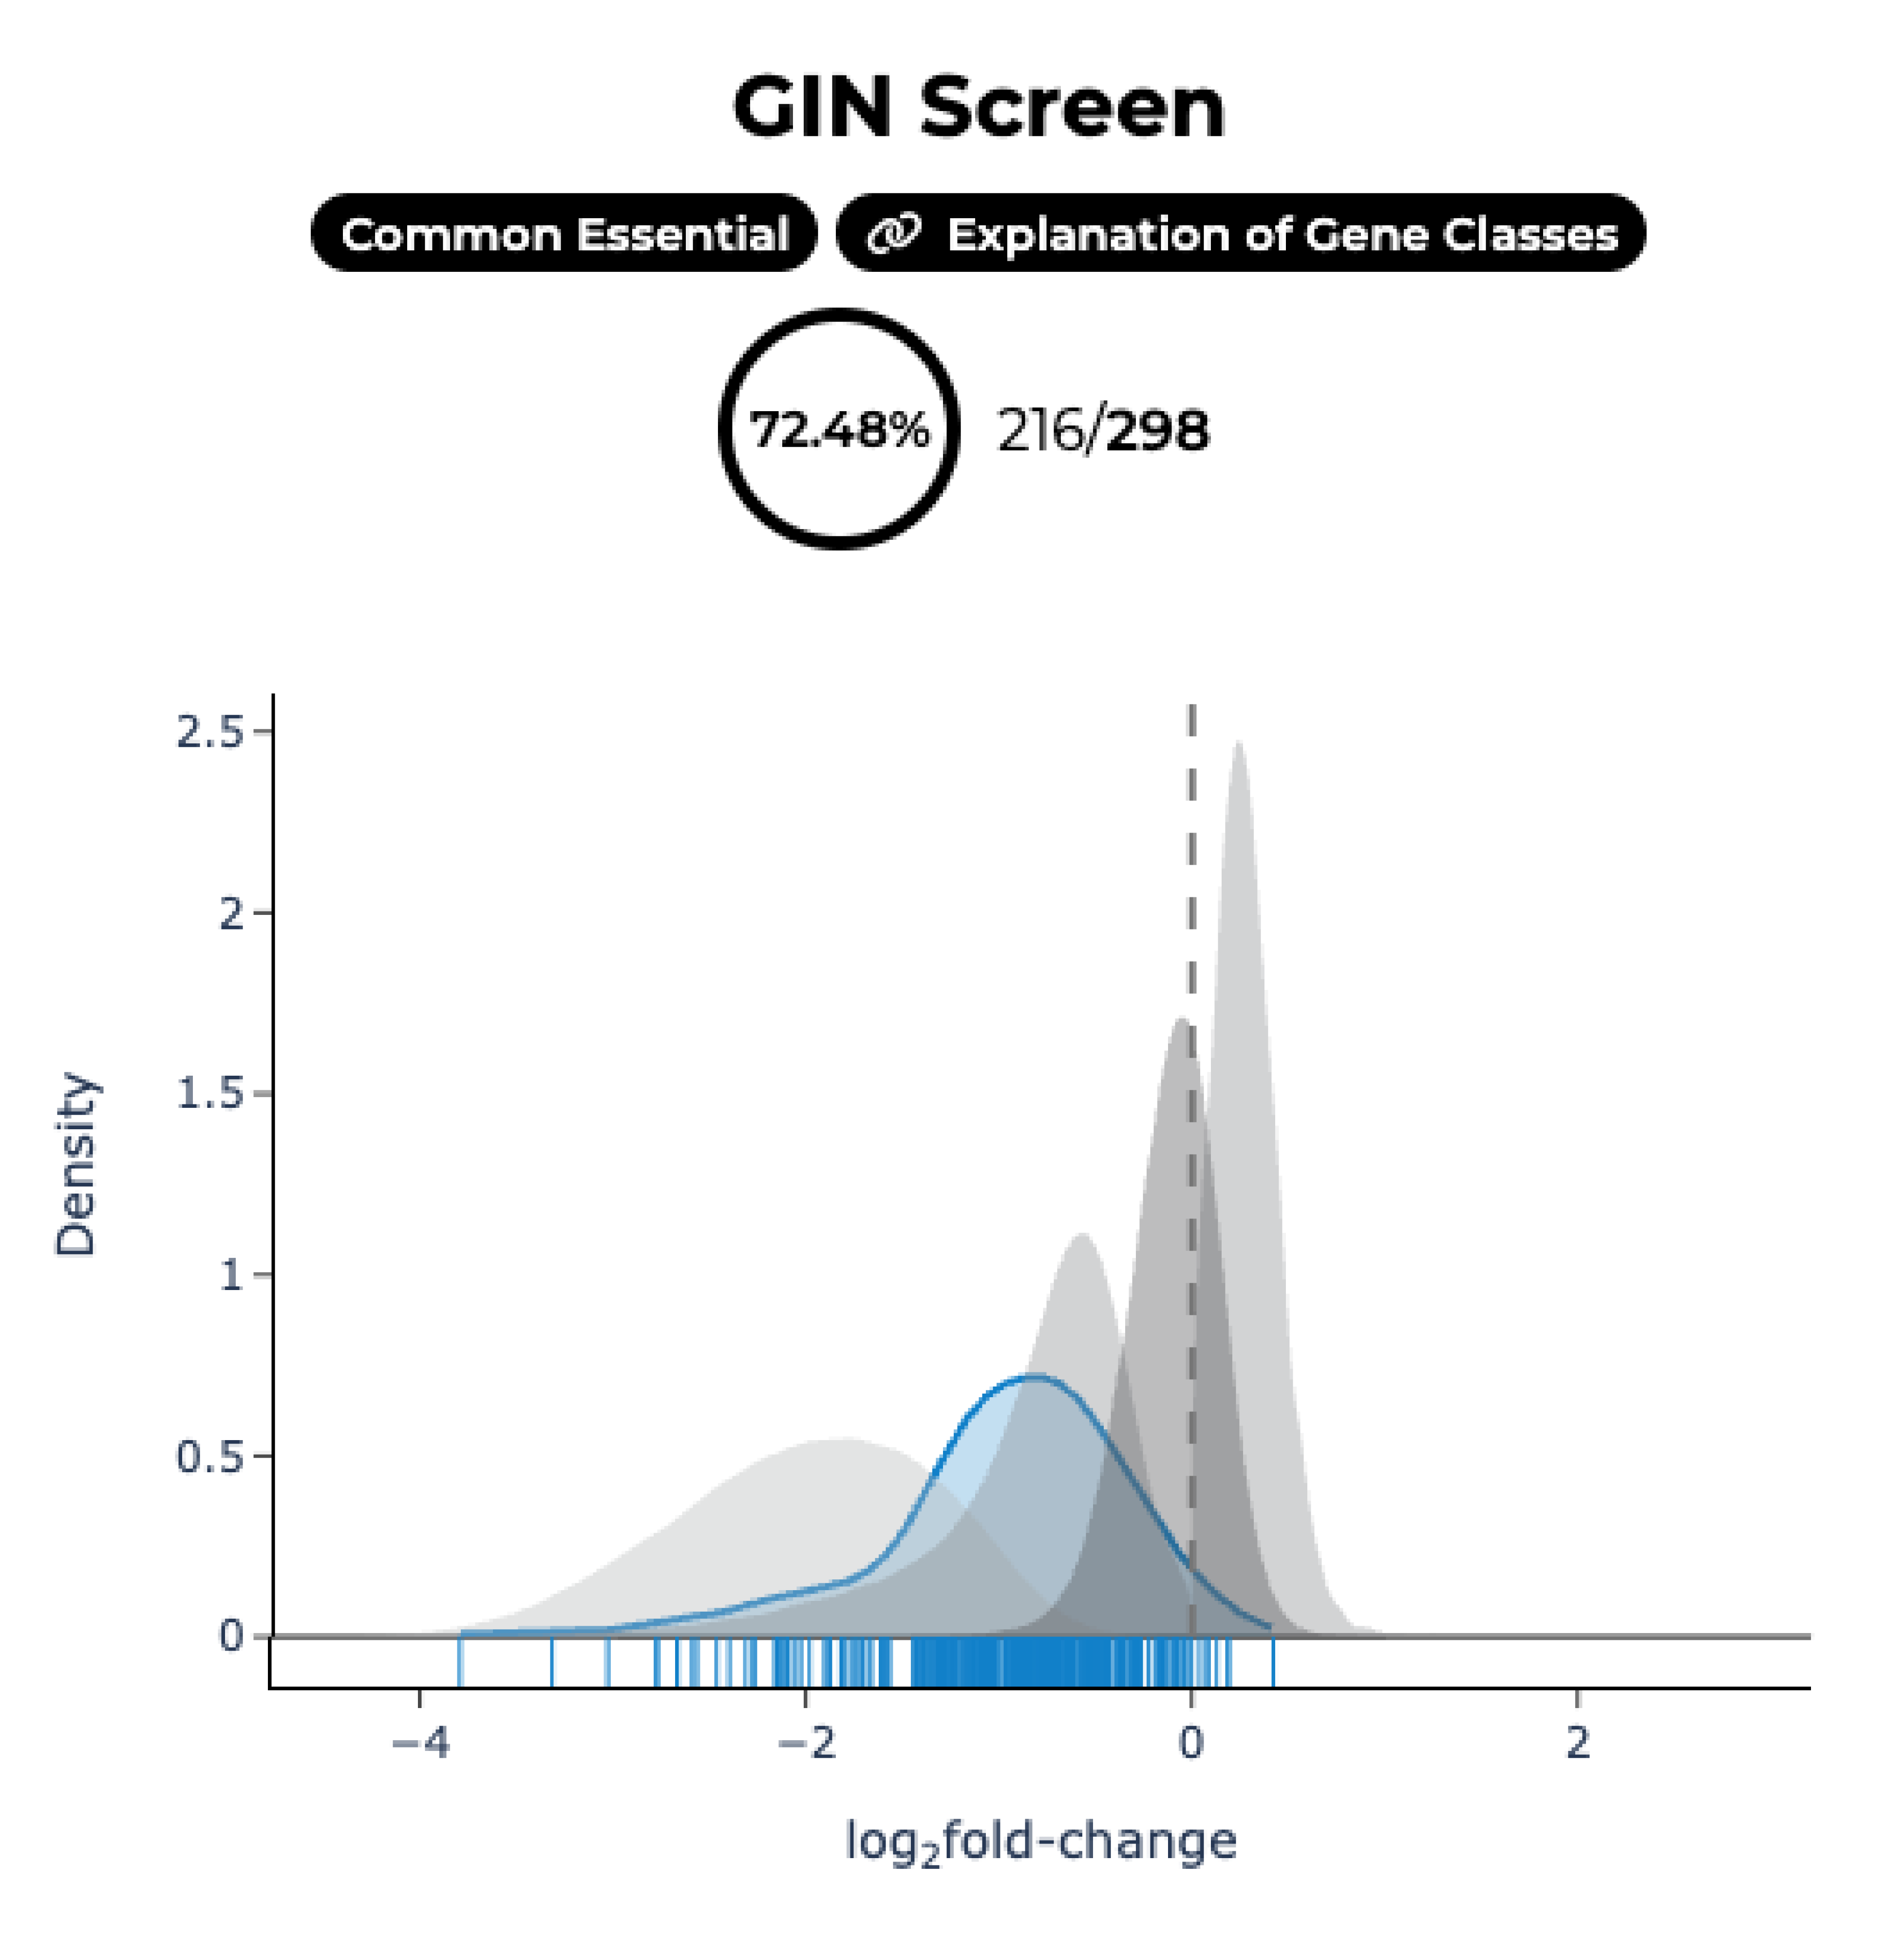
Genome-wide screens are performed in HAP1 cells lacking a given "query" gene. Differential dropout profiles are compared to "hybrid" profiles from 39 wild-type HAP1 screens to identify quantitative genetic interactions (qGI).

The Interface

Click on one of the buttons below for a detailed description of each data presentation element.
This plot shows the distribution (blue) of single-mutant fitness measurements for the gene-of-interest across all isogenic HAP1 screens, measured as log2(fold-change) at the end-point vs. T0. This is overlaid on reference distributions of gold-standard essential genes (furthest left), gold-standard non-essential genes (centered on zero), positive fitness effect (right shift), and non-essential fitness genes (left shift). There are also summaries of the number of screens where the gene is “essential”, and the fitness class that the gene falls into. Plots are shown for GIN screens as well as DepMap.
Scatterplot showing the change in fitness due to gene knockout in wild-type HAP1 cells (x-axis) vs an isogenic query cell line. Significant negative genetic interactions are shown in blue, positive genetic interactions in yellow. The gene-of-interest is shown as a red point.
Scatterplot shows the qGI score (y-axis) for the gene of interest across all of the query cell lines screened (x-axis). The top 10 most extreme points are labelled, but you can mouse over individual points to see metrics such as qGI score and FDR, rank, and the exact screen ID. Dotted lines indicate threshold for being considered a stringent hit.
Scatterplot that shows the qGI values for the gene-of-interest (x-axis) and a gene chosen from the table of top correlated genes (y-axis) across all 298 query screens. Points are coloured according to their molecular function category.

Publications and How to Cite

Main publication

Billmann, M., et al. Cell. Epub 27 Apr 2026. doi: 10.1016/j.cell.2026.03.044

Datasets

Additional publications

Quantitative analysis of genetic interactions in human cells from genome-wide CRISPR-Cas9 screens.
Billmann M, et al. bioRxiv [Preprint]. 2026 Jan 5:2025.06.30.662330. doi: 10.1101/2025.06.30.662330.PMID: 41542642

Genetic suppression features ABHD18 as a Barth syndrome therapeutic target.
Masud SN, et al. Nature. 2025 Sep;645(8082):1029-1038. doi: 10.1038/s41586-025-09373-5. Epub 2025 Sep 3.PMID: 40903572

A global genetic interaction map of a human cell reveals conserved principles of genetic networks.
Billmann M, et al. bioRxiv [Preprint]. 2025 Jul 2:2025.06.30.662193. doi: 10.1101/2025.06.30.662193.PMID: 40631273